Monthly Archives: September 2015

September takes off

Percent of GTA houses sold over asking.

Two weeks after Labour Day, and the Toronto market has been its typical, irrepressible self! Average prices are up as predicted, and home buyers are out in full force.

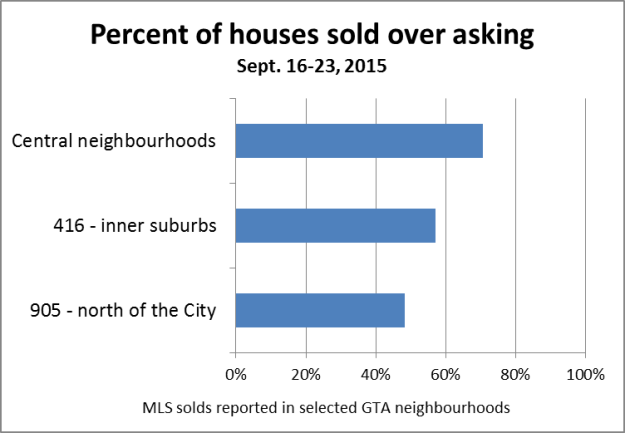
The chart tells a simple story. Across the GTA, house buyers are competing for properties. Overall, about half of the houses reported sold in the last seven days went over asking. In the central core neighbourhoods, our sample showed a remarkable 71% of sales where the buyers paid over the asking price.

Bidding wars spread

Toronto’s inner suburbs have been experiencing strong price growth for several years, and increased interest from multiple buyers. And most of the 905 area has felt an increase of “downtown-style” bidding wars this year. Figures from Vaughan and Richmond Hill above show that 48% of houses sold last week went over asking.

Based on comments from many agents, both at Sage and other brokerages, there were anywhere from three to ten bids on a large number of houses this month. Even some condos were receiving multiple offers. Meanwhile, a few listings were ignored by buyers, including well-priced houses where buyers may have simply assumed that the final price would be too high.

The right time to sell
There will continue to be a shortage of listings this fall. Do you know someone who may be ready to sell their home? Do them a favour and put us in touch. With our expert marketing, that home will get sold quickly and for the highest price! You can email us, or call James and Joanne at 416-483-8000.

GTA Market Update – Sept. 12, 2015

Toronto home prices 2015

Watch the dotted line
No, this is not an optical trick! Each month, as we update this chart, our first instinct is to look at the latest price point (the black line). While this is useful to know, our dotted line (in gray)  actually packs a lot of data…

We call it “projected.” The dotted line is actually made up of two components – the shape, and the placement. The shape comes from a calculation of month-to-month changes in the Toronto market, going back about 20 years. The placement is more art than science: In January, we position our dotted line to represent approximately what an average yearly increase would represent for the coming year. Historically, this works out to around 6% for the GTA.

Seasonal behaviour is real
We like the dotted line because it represents a confirmed behaviour: home prices really do fluctuate during the twelve-month period, in a predictable way. At the same time, each calendar year is a bit different, and the dotted line helps us to spot those trends.

This year’s trend sticks out a mile! In early 2015, the average home price in Toronto and the 905 area shot up by $100,000. In August it was down again, by around $50,000. By October, the dotted line is saying, that number could be up another $30,000. The black line suggests that could be the full $50,000 again. We’ll know soon enough.

The right time to sell
There will be a shortage of listings this fall. Do you know someone who may be ready to sell their home this year? We’d like to hear from you. With our expert marketing, that home will get sold quickly and for the highest price! You can email us, or call James and Joanne at 416-483-8000.